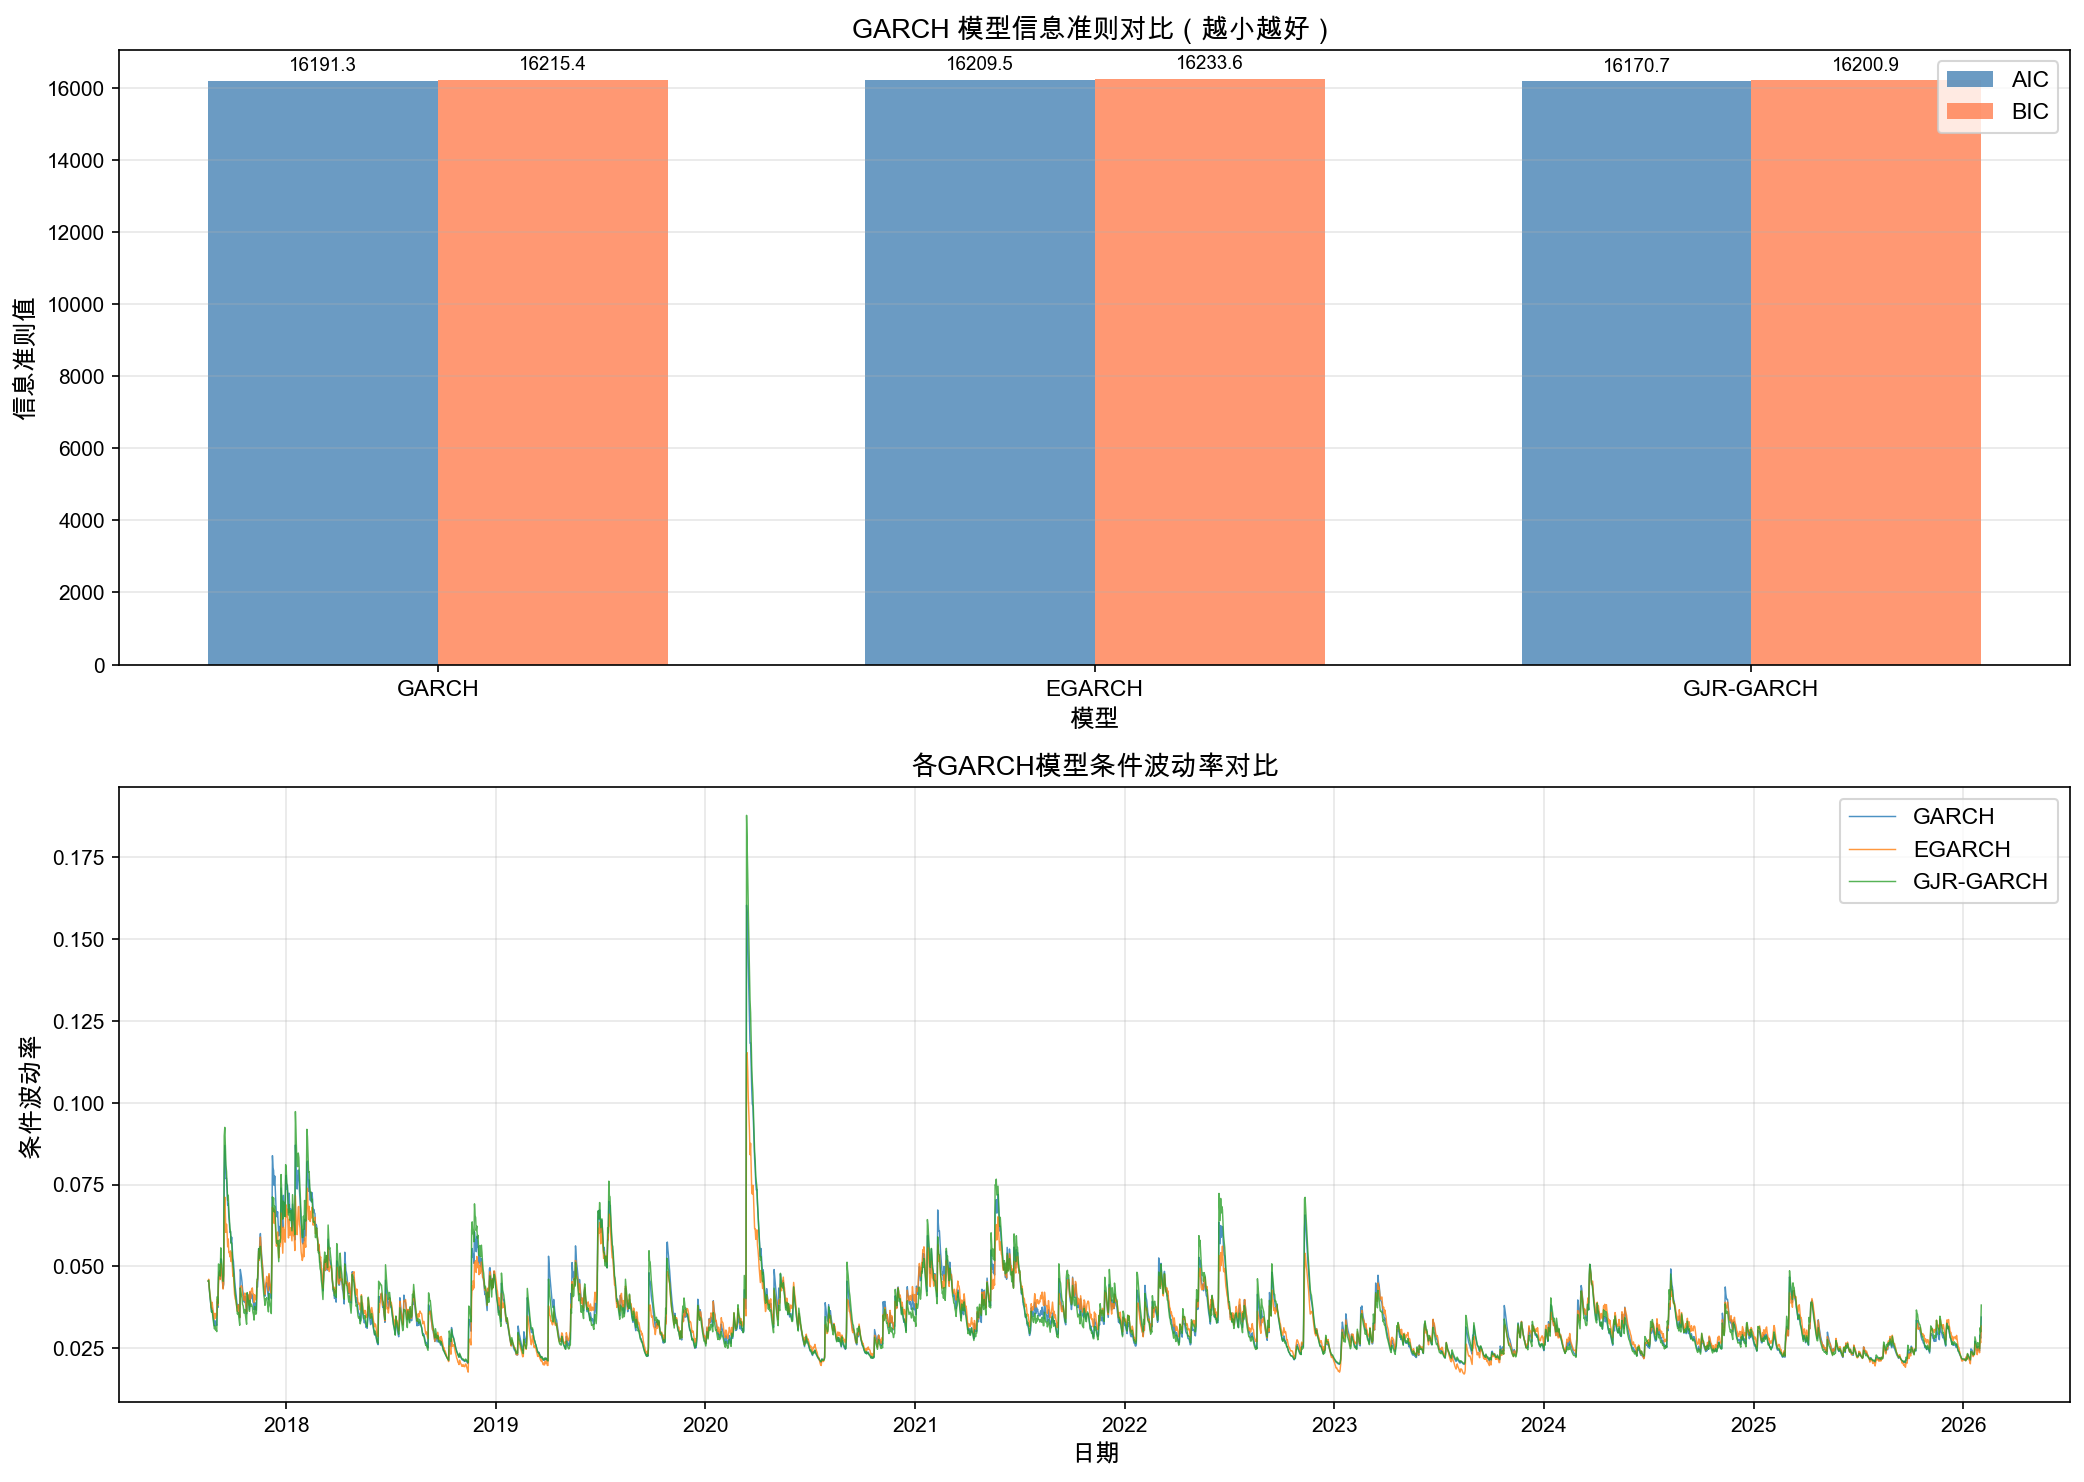
Complete statistical analysis pipeline covering:
- FFT spectral analysis, wavelet CWT, ACF/PACF autocorrelation
- Returns distribution (fat tails, kurtosis=15.65), GARCH volatility modeling
- Hurst exponent (H=0.593), fractal dimension, power law corridor
- Volume-price causality (Granger), calendar effects, halving cycle analysis
- Technical indicator validation (0/21 pass FDR), candlestick pattern testing
- Market state clustering (K-Means/GMM), Markov chain transitions
- Time series forecasting (ARIMA/Prophet/LSTM benchmarks)
- Anomaly detection ensemble (IF+LOF+COPOD, AUC=0.9935)

Key finding: volatility is predictable (GARCH persistence=0.973),
but price direction is statistically indistinguishable from random walk.

Includes REPORT.md with 16-section analysis report and future projections,
70+ charts in output/, and all source modules in src/.

Co-Authored-By: Claude Opus 4.5 <noreply@anthropic.com>
234 KiB
2084x1482px
234 KiB
2084x1482px